%20playeasy%20logo.png?width=150&height=34&name=(PNG%20BLACK)%20playeasy%20logo.png "(PNG BLACK) playeasy logo")
.svg)

Every touchpoint,
finally visible.
Compass Insights gives your team real-time visibility into engagement, reach, and visitor relevance — across every site, every partner, every touchpoint you've deployed. No more guessing. No more manual reports.
Reach, engagement,
and relevance — all in one view.
Every DMO generates data. Very few can see it clearly. Insights surfaces what's happening across your entire visitor experience — so your team always knows where you stand.
Every impression across your entire distributed experience — your DMO site, partner sites, event organizer pages, and on-site QR codes — unified in one view, fully attributable to your DMO.
Where visitors are finding you, and what they're finding once they do — hotels, AI conversations, deals, event sites, and more. See which placements are driving the most engagement and conversions.
Every interaction tracked — conversations, questions, bookings, redemptions, clicks, and views. See exactly how your content and your voice are shaping visitor behavior, with proof to back it up.
Everything happening across your visitor experience, on one screen.
Compass Insights is a suite of real-time dashboards that surface what's happening across every distributed touchpoint — so your team always has the answer before the question is even asked.

Conversation Quality Analysis
Understand how well your Compass Tour Guide is actually performing. Every conversation is automatically scored and reviewed — so your team knows exactly where responses are strong, where they fall short, and what needs to improve.
- Every Tour Guide conversation scored for response quality and relevance
- Low-scoring responses flagged and surfaced for review
- Full conversation transcripts readable in-dashboard
- Identify root causes — missing content, unclear phrasing, outdated information
- Filter by date range, deployment site, or topic to isolate issues

Conversation Volume Analysis
Track how many visitors are engaging with your Compass Tour Guide — and how that engagement is growing over time. Understand where conversations are happening, what's driving them, and how your reach is expanding across every touchpoint.
- Total conversation volume tracked across every deployment site
- Engagement trends surfaced week over week and month over month
- Breakdown by source — DMO site, event organizer pages, partner sites, QR codes
- Traffic attribution showing where your Tour Guide conversations are coming from
- Accelerating volume signals a growing, more engaged visitor audience

Elements Engagement Dashboard
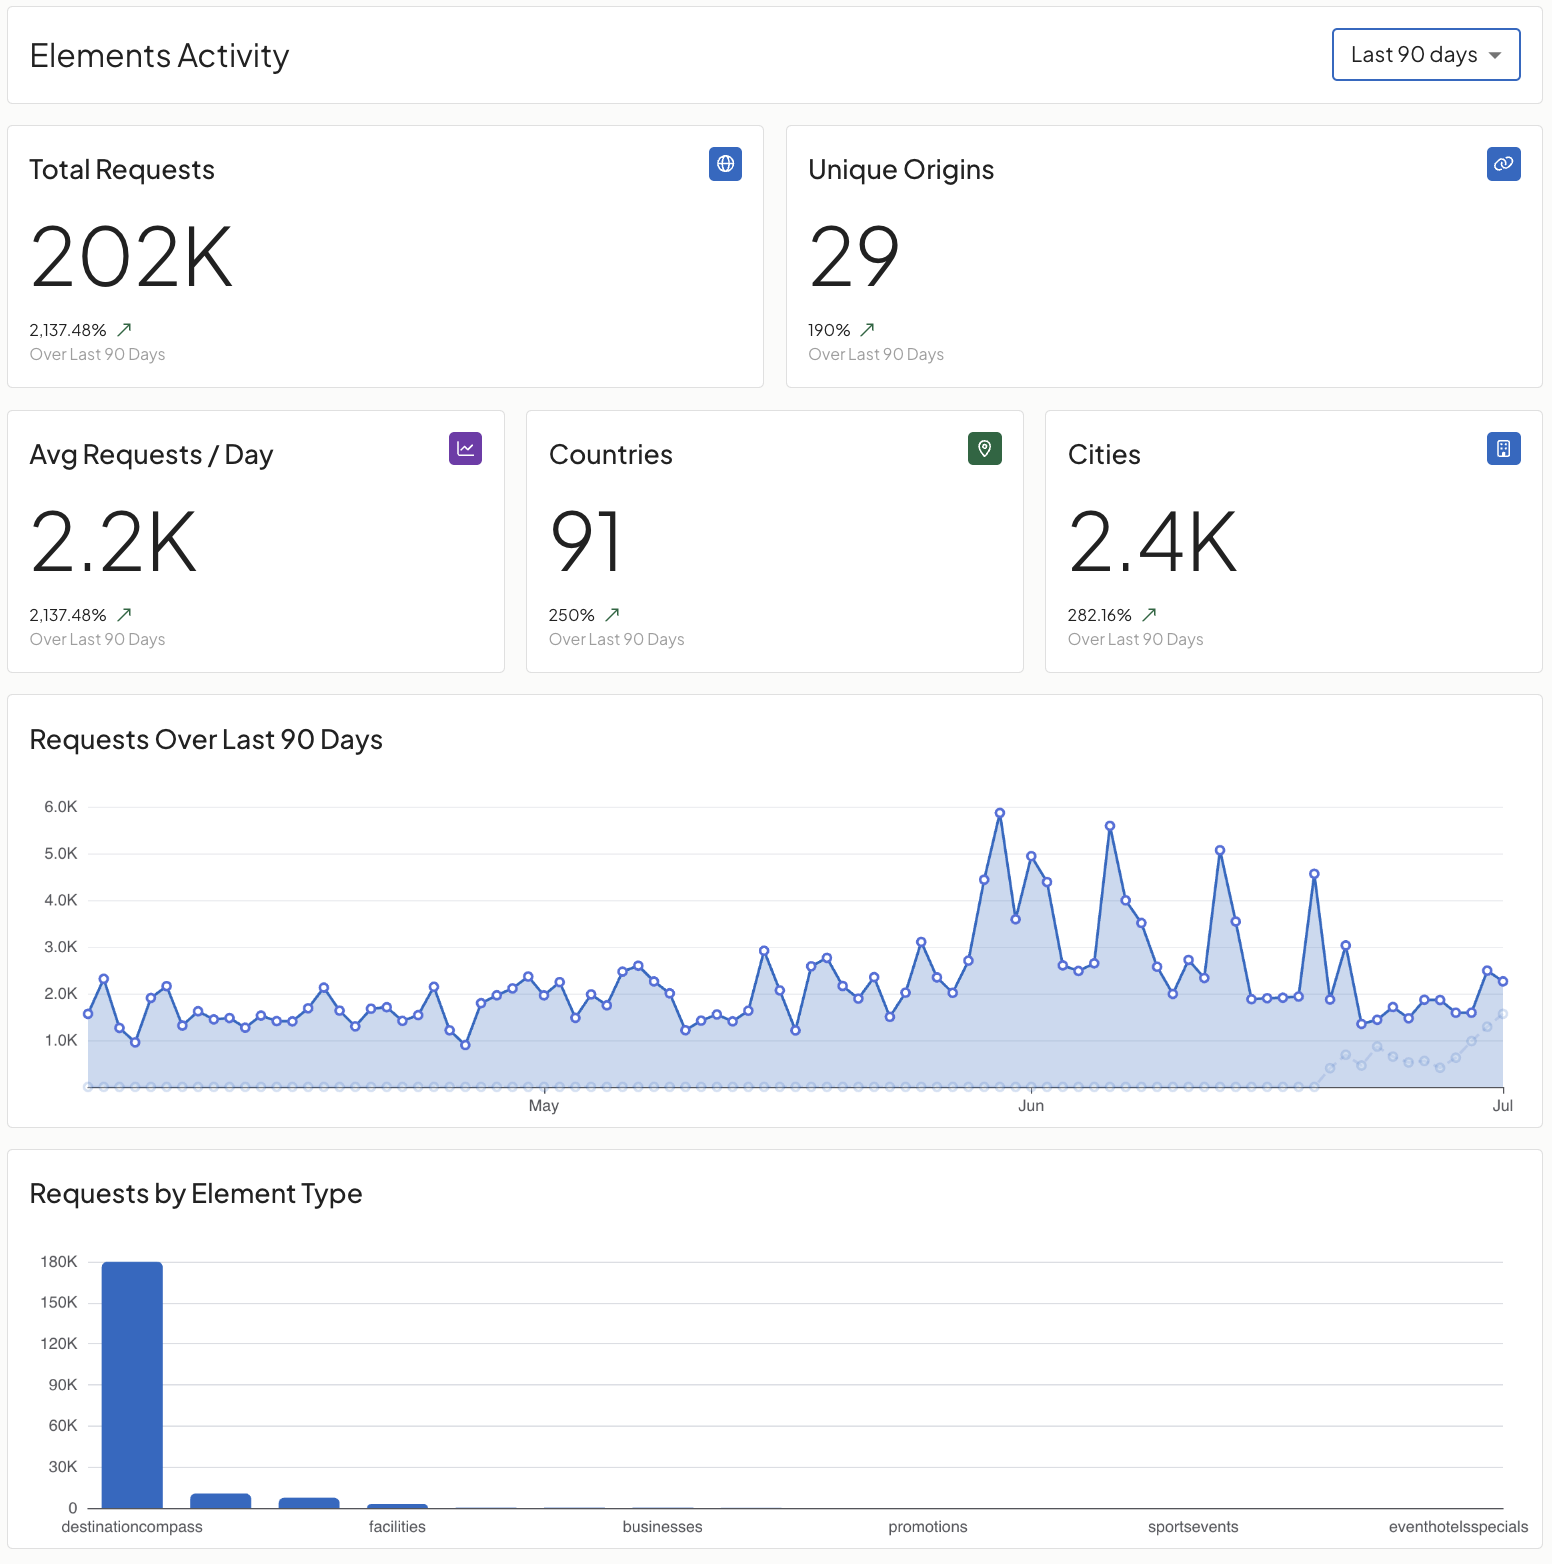
See exactly how each Compass Element is performing — broken down by element type and by the site it's deployed on. Know which elements drive the most engagement, and where to double down.
- Per-element performance: AI Tour Guide, Hotel Booking, Deals, Listings, Microsites
- Per-site breakdown — which partner sites are driving the most engagement
- Click-through and conversion rates by element type
- Room block usage and live rate booking data
- Deals views, clicks, and redemption rates per offer
Keyword Analysis Dashboard
The actual language your visitors use when they talk to your Tour Guide — mapped visually over time. Spot what's trending before it becomes a problem, and see exactly where your content has gaps.
- Top keywords and phrases extracted from every conversation
- Trending topics surfaced week over week
- Questions with no good answer flagged as content gaps
- Seasonal patterns visualized — what visitors ask about in peak vs. off-season
- Filterable by event, partner site, or deployment type

Nothing hidden.
Everything visible.
Reach, engagement, and relevance — across every touchpoint you've deployed, in one place, in real time. See it all, and know exactly where you stand.